for CS Chart Recorder
Where energy conservation is a top priority for all progressive enterprises, the measurement of flow rates and consumption is becoming more and more important. However, measurement is just one step forward, in order having a complete picture of the gas and compressed air consumption in a manufacturing plant, a permanent monitoring, an graphical/statistical analyzes and a convenient reporting is required. For this purpose we have developed a software which is for system monitoring and analysis.
All important functions can be retrieved via the dashboard. Global Settings: Adjust units and change decimal places, store company name and logo:
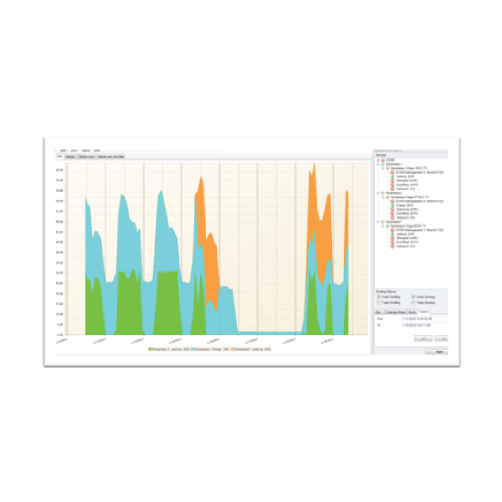
All measurement curves are indicated in terms of color. All necessary funktions like free zoom, selection/deselection of single measured curves, free selection of periods, scaling of the axes, selection of colors and so on are integrated: This view can be stored as pdf file and sent by e-mail. Different data can be merged to one common file.
All measuring points are listed with the exact time interval. The desired measuring channels with the measuring site name can be selected via the diagram explorer.
All necessary statistics data are apparent at a glance. So the user can quickly see which minimun or maximum measured values occurred at which time and for how long.
The software carries out flow analysis for all connected flow sensors optionally as daily, weekly or monthly report.